potential energy curve
繪製Potential energy curve
以H2 + H → H + H2 reaction為例
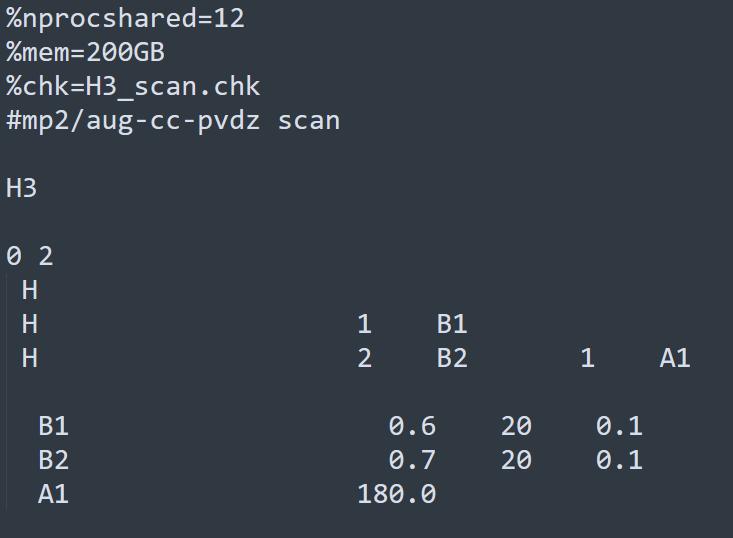
1.先創立input file,確定要掃描的範圍
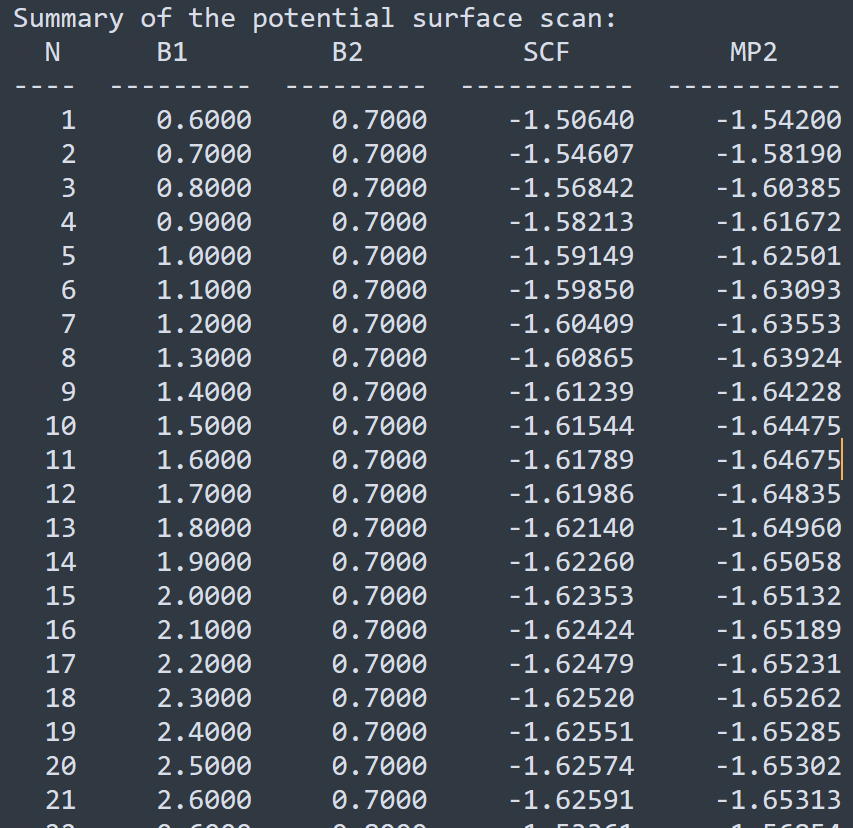
2.進行計算後,打開out file,尋找potential surface的資訊
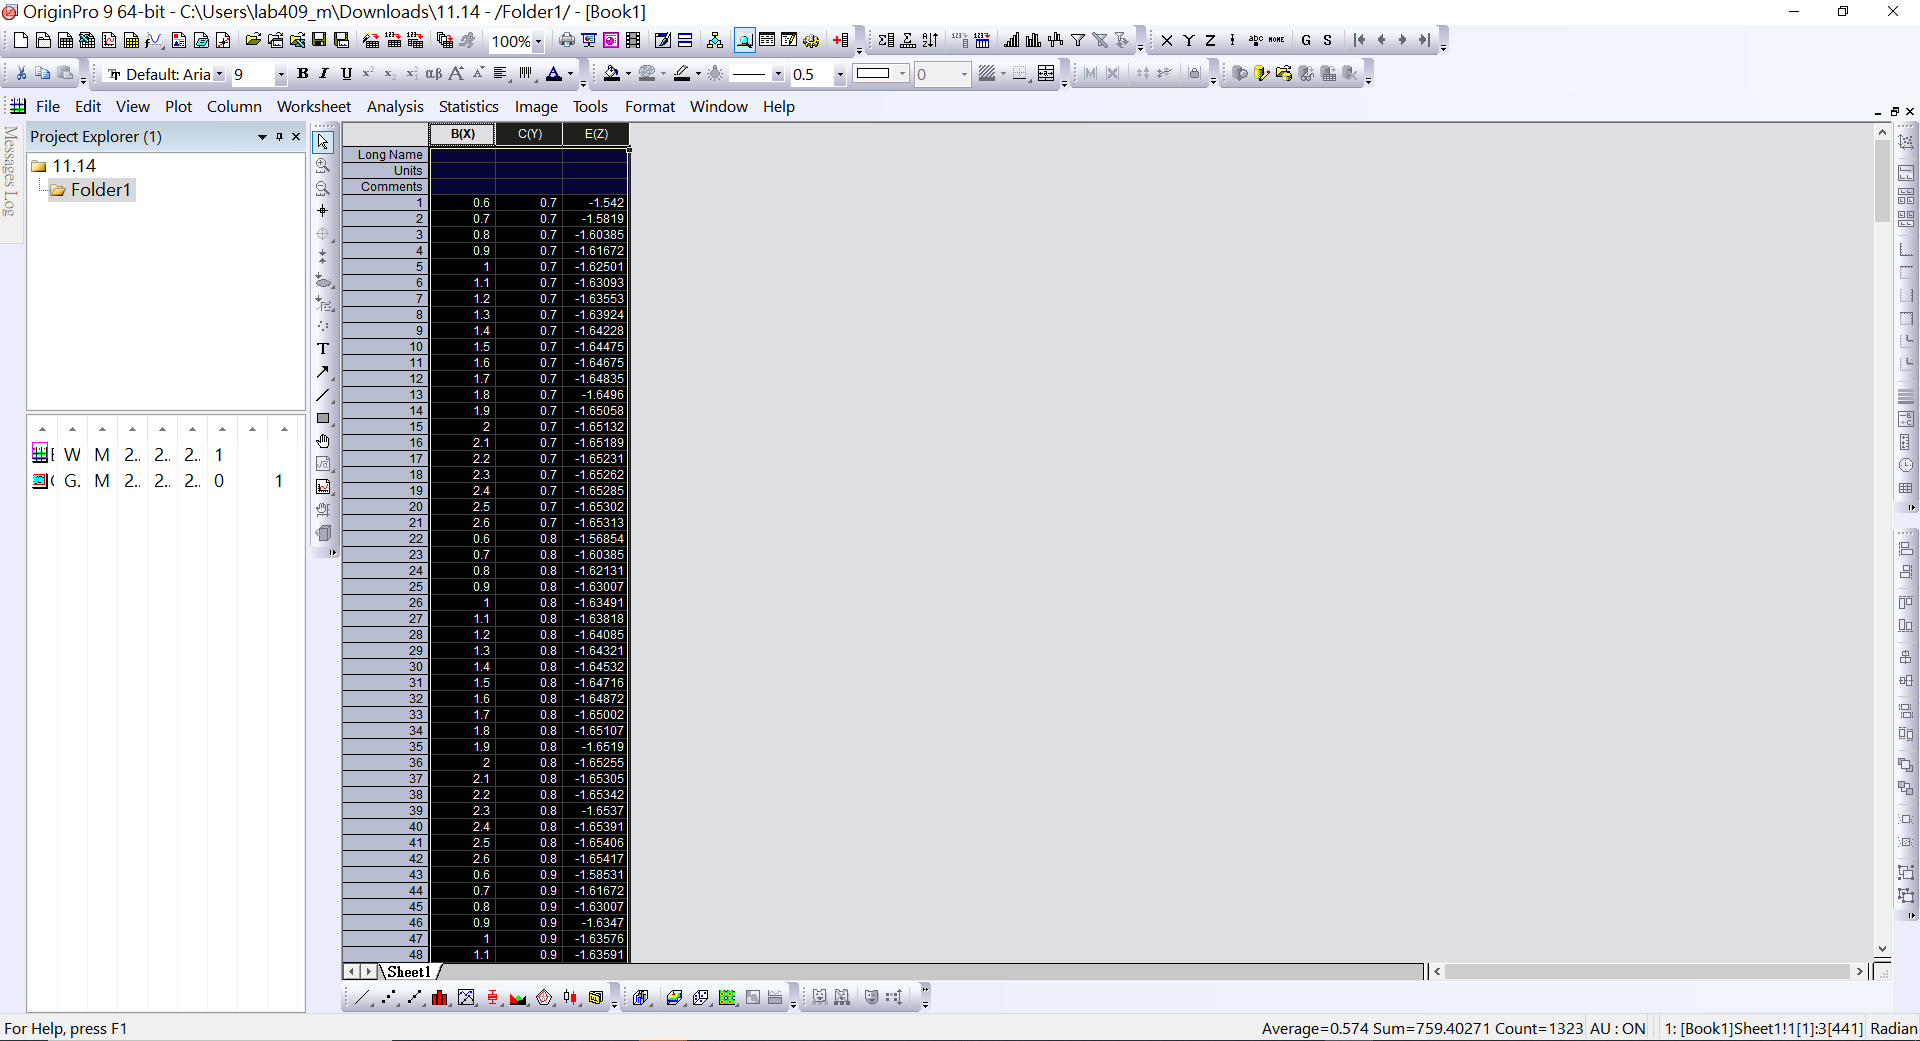
3.打開OriginPro,將data放入OriginPro
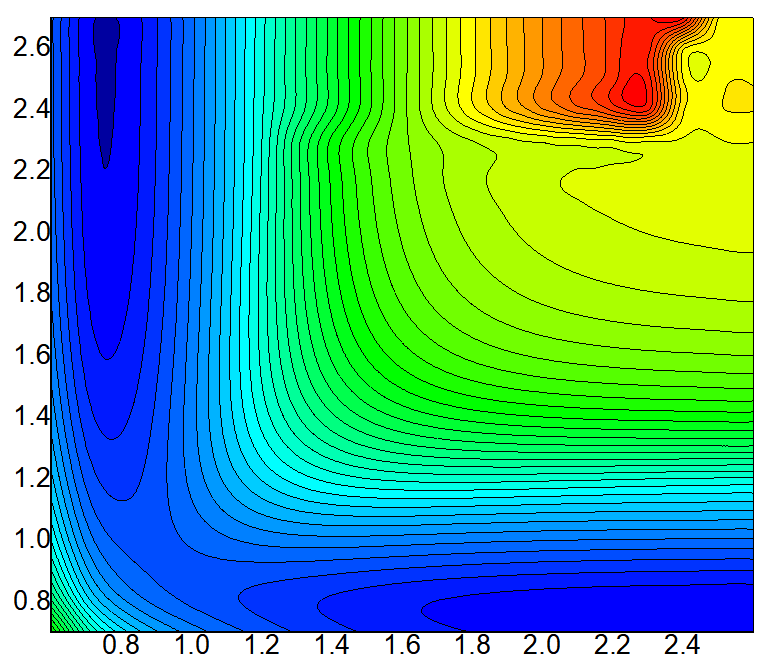
4.點選 plot -> contour -> color fill 產生Potential energy curve
5.關掉 Speed Mode is on ,Graph > Speed Mode >將Speed mode 按 off
6.調整圖片,即可得到類似下方圖片